The last paragraph in a 2013 paper, Willis et al, “Tracking cod diet preference over a century in the northern Gulf of Maine: historic data and modern analysis” (link), says it all. “Historical data provide insights into the structure and function of ecosystems that, today, are impaired in their function. The results from our analysis comparing modern survey data with data from 1896 and 1965 point to significant, long-term changes in the coastal GOM marine food web with important implications for the recovery of cod and other groundfish, and the resilience of an ecosystem now dominated by invertebrates. Restoring alewives, menhaden, and Atlantic herring may be essential in bringing back coastal cod populations and rebuilding complexity in an impoverished ecosystem. Finally, this historical perspective challenges notions of sustainability by reminding us what a truly productive, diverse, and resilient ecosystem looked like and how the public perspective has drifted to accept remnant populations as the new normal.”
Biological data is used to manage the fishery, but it is not about biology, but statistics.
The below graph is from ASMFC’s “Guide to Fishery Management and Stock Assessments”.
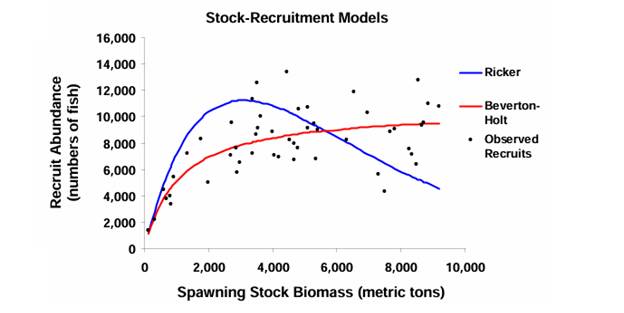
The Beverton-Holt model shown above was developed in 1957 and is the basis for NEFSC’s Woods Hole Assessment Model (WHAM), along with other biological data collected. Ignore the Ricker curve, it simply does not match the data, starting off higher than the data and ending up below the data.
The Beverton-Holt model is a classic example of the law of diminishing returns, where each incremental increase in spawning stock biomass will produce a smaller increment of increase in the number of recruits, based on some limiting factor.
So, what is the limiting factor? The major factor in growth of populations on earth for over 500 million years,(since the miraculous evolution of chlorophyl) has been the abundance of food. Based on the biology of fish, and a little statistics, the food supply can affect recruitment rate in the following 4 ways:
- The larvae and juvenile fish’s main source of food is plankton.
- Eggs, larvae and juvenile fish are under constant predatory pressure. An abundance of forage fish increases the probability of the more valuable fish surviving to adulthood.
- Spawning takes a lot of energy for the fish. A healthy, well-nourished female fish will lay more eggs per individual and per pound of body weight, the eggs will be larger and be higher in lipids, leading to larvae and juveniles, with a higher likelihood of survival to adulthood.
- With fish, warmer water increases their metabolism, which increases their need for nutrients. If there is not enough high energy forage, they will show the same symptoms, low body weight, low egg production and low recruitment as does low nutrition. An abundance of high lipid forage will make the fish more tolerant of the higher temperature waters, up to a point.
Will Rogers, or maybe Mark Twain, may have said, “It ain’t what you don’t know that can hurt you as much as what you know for a fact that ain’t so”.
The NEFSC State of the Ecosystem Report New England has a chart, Total Primary Production, which is the amount of algae produced, and that has been constant. TPP is the food for larvae and juveniles. This indicates that there is an abundance of food for juveniles.
The NEFSC State of the Ecosystem Report New England has another chart on Forage Index, which is an index of forage biomass. This has been constant for the last 40 years and has been widely touted as evidence that food supply is not an issue. This is what is accepted as fact that ain’t so. Read on.
The NEFSC State of the Ecosystem Report New England has a third chart of energy density of various forage species. I searched and I also used AI to search for any record of combining energy density with the forage biomass index and none could be found. It appears that in all these years, someone would have had the intellectual curiosity to calculate the energy density of the forage biomass-it must be out there somewhere.
In the late 1970’s, after heavy fishing from foreign fleets, the Atlantic herring population collapsed. In the 1990’s, the capelin and cod populations collapsed, and menhaden disappeared from the Gulf of Maine. A statistical correlation does not prove causation, but statistics are a very good tool to identify an area for further consideration. A study by Willis et al (link) found that in 1965, Atlantic herring made up a large part of cod’s diet, from 70% in summer to 9% in winter. We also know that there is overlapping of the ranges of herring, menhaden, mackerel and capelin. We also know that forage fish are fungible (Interchangeable) and that, for the most part, consumption of a species is random and correlates with the relative abundance of the species. So, a possible scenario is that overharvesting of herring caused the collapse of the Atlantic herring in 1980. The herring and capelin ranges overlap, and the cod predation on capelin increased, but it wasn’t enough and both the capelin and cod populations collapsed in the 1990’s. Striped bass and many other predators, with a reduced population of herring, could have increased their predation on menhaden, and menhaden, also subjected to heavy harvesting pressure, disappeared from the Gulf of Maine in the 1990’s. It is very hard to prove causation, as so much has happening and it is so hard to get good data after the fact.
We also know that predatory fish may follow patterns, that are related to the forage. For example, striped bass’s migration will follow menhaden migrations and cod will go after alewives when they go upstream to spawn and when the juveniles enter the ocean. The latter is especially important to cod as they can fatten up on the lipids for spawning in the fall. Cod will also follow Atlantic herring migrations.
Menhaden, herring and mackerel are all high in lipids, giving them a high energy density. Since the collapse of the Atlantic herring population occurred in the late 1970’s, the much-touted forage index has been low in energy density. So, a low energy diet, combined with overharvesting, was likely the cause of the 1990’s cod collapse.
There is an article in Science, “Slow adaptation in the face of rapid warming leads to collapse of the Gulf of Maine cod fishery,” (link) that states, “Age 4 represents an energetic bottleneck for cod because of the onset of reproduction and reduced feeding efficiency as fish transition from benthic(bottom dwelling) to pelagic(not bottom dwelling) prey. Elevated temperatures increase metabolic costs in cod, exacerbating the energetic challenges at this age. The average weight-at-age of cod in the Gulf of Maine region has been below the long-term mean since 2002, and these poorly conditioned fish will have a lower probability of survival .” This is very significant statement, but why do they say, “reduced feeding efficiency” and “energetic challenges” instead of “dearth of high energy forage fish”? High energy content forage would certainly address the “energetic challenges” mentioned above. The next 3 paragraphs gives more insight into this subject.
There is an interesting paper, “A Bioenergetics Based Comparison of Growth Conversion Efficiency of Atlantic Cod on Georges Bank and in the Gulf of Maine” by Ivan Mateo of URI. (link) This was published in 2007.
“Overall growth performance for Atlantic cod was significantly lower at Georges Bank than in Gulf of Maine. Monthly individual consumption demand and specific growth rates for Atlantic cod calculated from the bioenergetic model were significantly higher on Georges Bank than in the Gulf of Maine. Increasing water temperatures approached the upper limits of thermal tolerances for cod in Georges Bank, possibly leading to decreasing growth efficiencies. Growth efficiency of cod in the Gulf of Maine was less variable than on Georges Bank due to the more homogenous temperatures and (lower) energetic content of diets found in the former location.” The paper goes on to state, “The cod from Gulf of Maine are found primarily within oligotrophic (Sparse populations of aquatic plants and algae) or mesotrophic (moderate levels of nutrients and biological productivity) systems, whereas the Georges Bank cod populations are in highly productive areas.”
Getting back to the Beverton-Holt and WHAM models, it appears that everything was done according to the best available science. Recruitment rate is a function of food supply, and the food biomass index and total primary production were tracked and were assumed to be adequate. However, the stock biomass kept declining; the populations were not sustainable. The flaw in the system is that the forage biomass is low in energy content because of the depletion of high lipid forage fish. Rather than find a solution, the WHAM model simply set new baselines. According to Willis, et al (link) “Certainly, the adoption of ever more sophisticated scientific methods has contributed to the ‘shifting baseline’ syndrome (Pitcher 2001, Pauly et al. 2002, Pauly & Maclean 2003).”
In the opening paragraph above, Willis et al recommended, ” Restoring alewives, menhaden, and Atlantic herring may be essential in bringing back coastal cod populations and rebuilding complexity in an impoverished ecosystem.” I agree. Please check out topics, Root Cause and The Solution.